15.1. UCS Dashboard#
The UCS Dashboard app allows administrators to view the state of the domain and individual servers can be read quickly and clearly on so-called dashboards. The dashboards are accessible via a web browser, access a database in the background, and deliver continuously updated reports on specific aspects of the domain or server.
15.1.1. Installation#
The UCS Dashboard consists of the following parts:
- UCS Dashboard
The UCS Dashboard app for the visualization of data from the central Database. This component is based on the software Grafana [1].
- UCS Dashboard Database
The UCS Dashboard Database app, a time series database for storing of the metrics. This database is based on the software Prometheus.
- UCS Dashboard Client
The UCS Dashboard Client app for deploying the metrics of server systems. This is based on the Prometheus Node Exporter.
The app UCS Dashboard can be installed from the Univention App Center on a server in the domain. The installation is only supported on the system roles Primary Directory Node, Backup Directory Node or Replica Directory Node. The apps UCS Dashboard Database and UCS Dashboard Client are automatically installed on the same system.
15.1.2. Usage#
After the installation, the UCS Dashboard is linked in the portal.
Alternatively, it can be accessed directly via
https://SERVERNAME-OR-IP/ucs-dashboard/.
By default access is only granted to users of the group Domain Admins (e.g.
the user Administrator).
15.1.2.1. Domain dashboard#
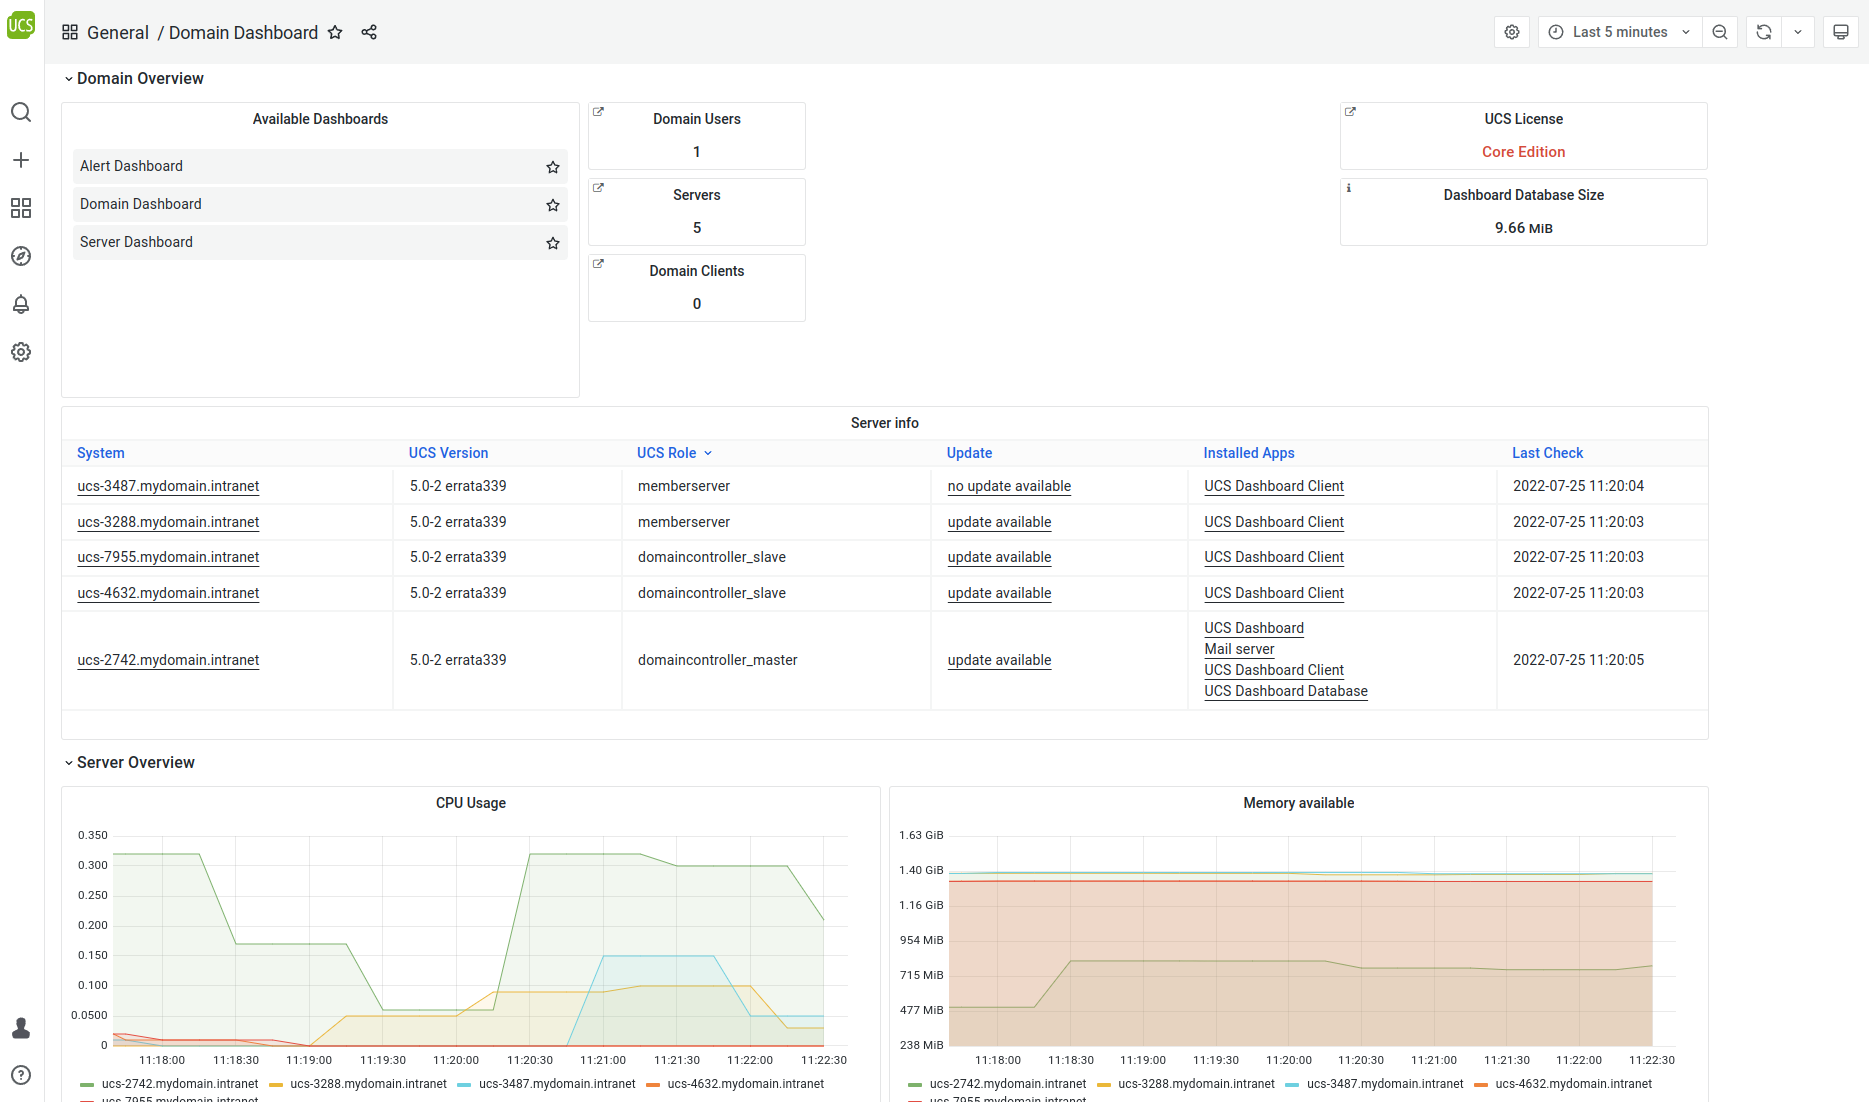
Fig. 15.1 Domain dashboard#
After the login, the Domain Dashboard is opened by default. On this dashboard, general information about the domain is displayed, such as how many servers and how many users exist in the environment.
Furthermore, the UCS systems are listed on the dashboard, in a tabular overview, including further information, such as the server role, the installed apps or whether an update is available or not.
In addition, the CPU usage, memory usage, free hard disk space and the status of the LDAP replication are displayed. In this graphics all servers are displayed together.
15.1.2.2. Server dashboard#
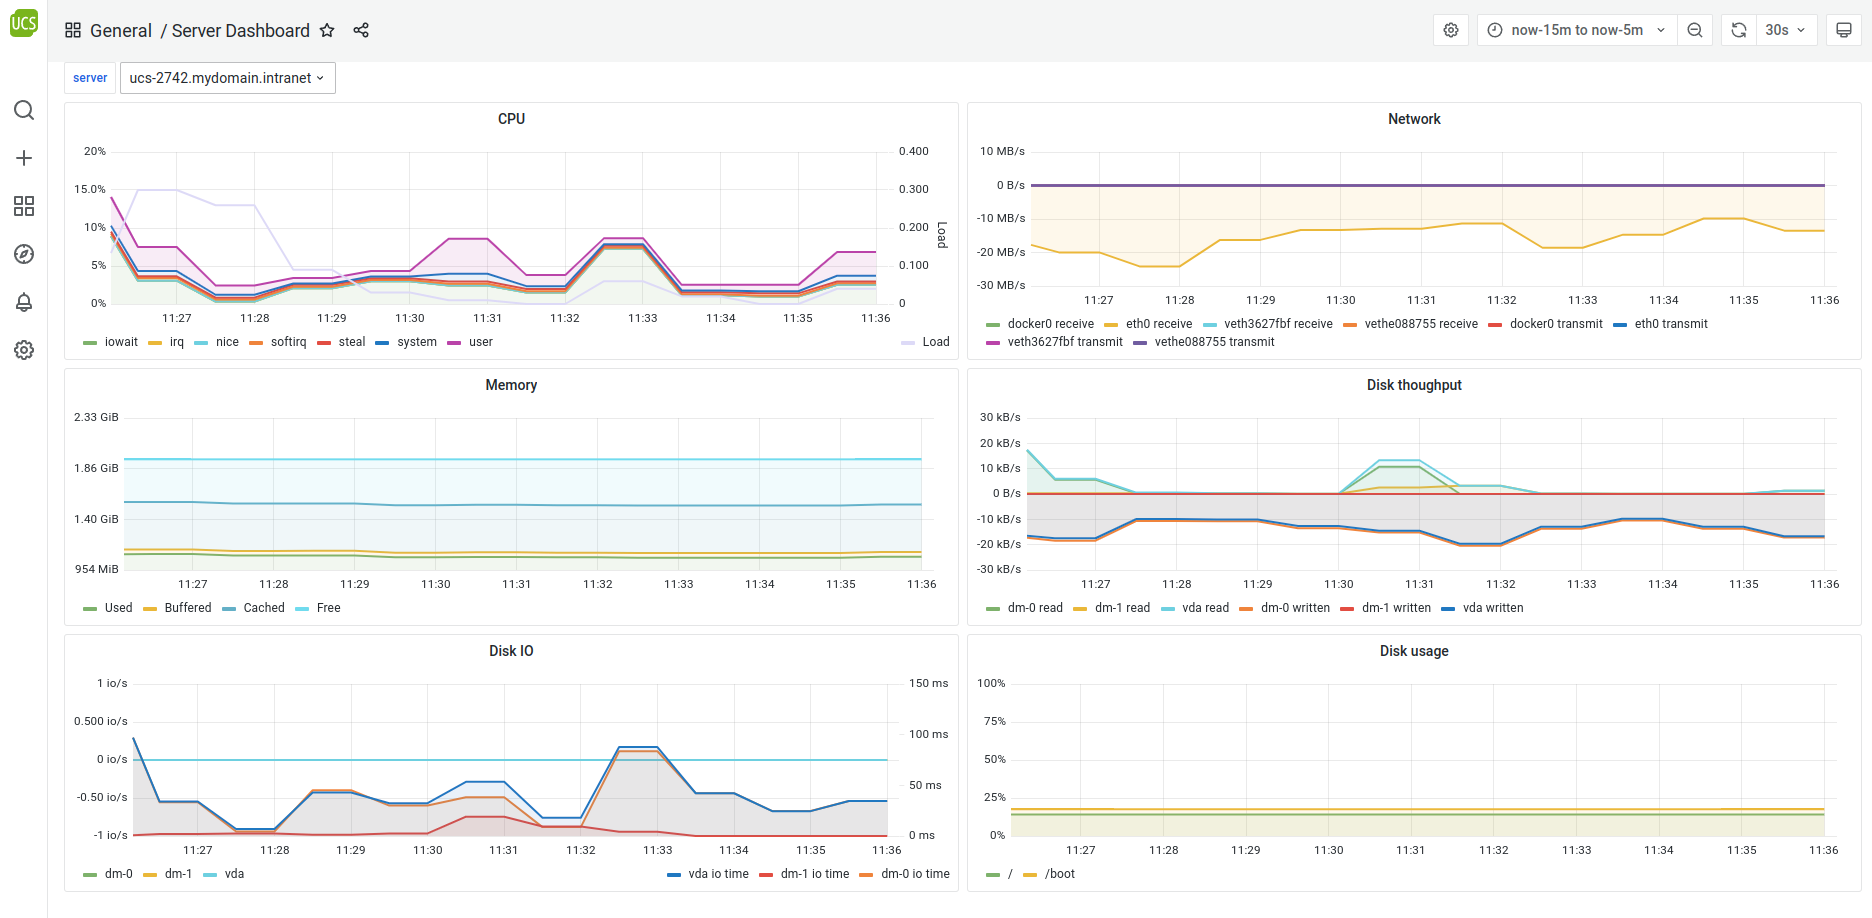
Fig. 15.2 Server dashboard#
By default, the Server Dashboard is also configured. On this dashboard, detailed information about individual server systems are shown, such as the CPU- or memory usage or network throughput.
The servers can be selected in the drop down server. Then the graphics show the details about the selected server.
15.1.2.3. Alert dashboard#
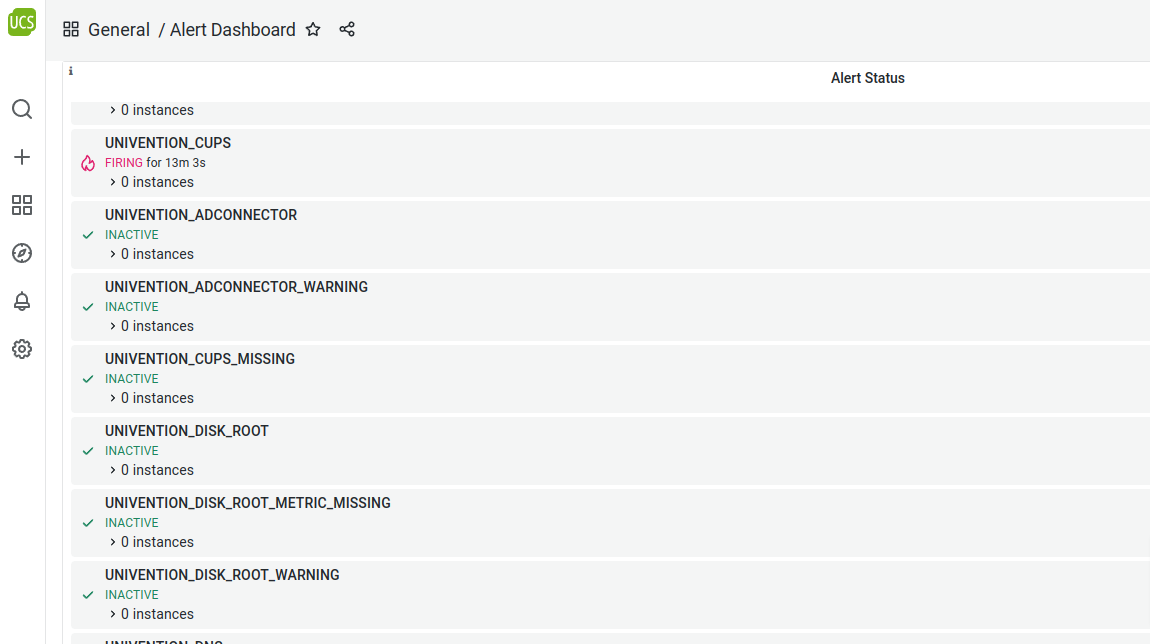
Fig. 15.3 Alert Dashboard#
By default, the UCS Dashboard app configures the Alert Dashboard. The Alert Dashboard shows detailed information about the status of all alerts, configured in UCS.
15.1.2.4. Own dashboards#
Administrators can’t change the three included dashboards Domain Dashboard, Server Dashboard and Alert Dashboard, because Univention provides updates for them.
Instead, you can create your own dashboards. On these dashboards you can then either add already existing elements or new elements can be created. All you need to do is click on the plus sign on the left side. A new dashboard will be created which can be filled with elements.