15.2. Monitoring#
Added in version 5.0-2: UCS 5.0-2 supports monitoring alerts through Prometheus metrics.
With Prometheus, Prometheus Node Exporter, and Prometheus Alertmanager, administrators can verify the correct function of complex IT structures from networks, computers and services continually and automatically.
Prometheus Node Exporter exports a comprehensive collection of metrics into the Prometheus database. Besides polling system indicators like CPU, memory usage, and free disk space, they test availability and operation of different services like SSH, SMTP, and HTTP. Operation tests generally perform program steps such as the delivery of a test email or the resolution of a DNS record. The Prometheus Node Exporter provides UCS specific alerts in addition to the start metrics already included, for example an alert for the listener/notifier replication.
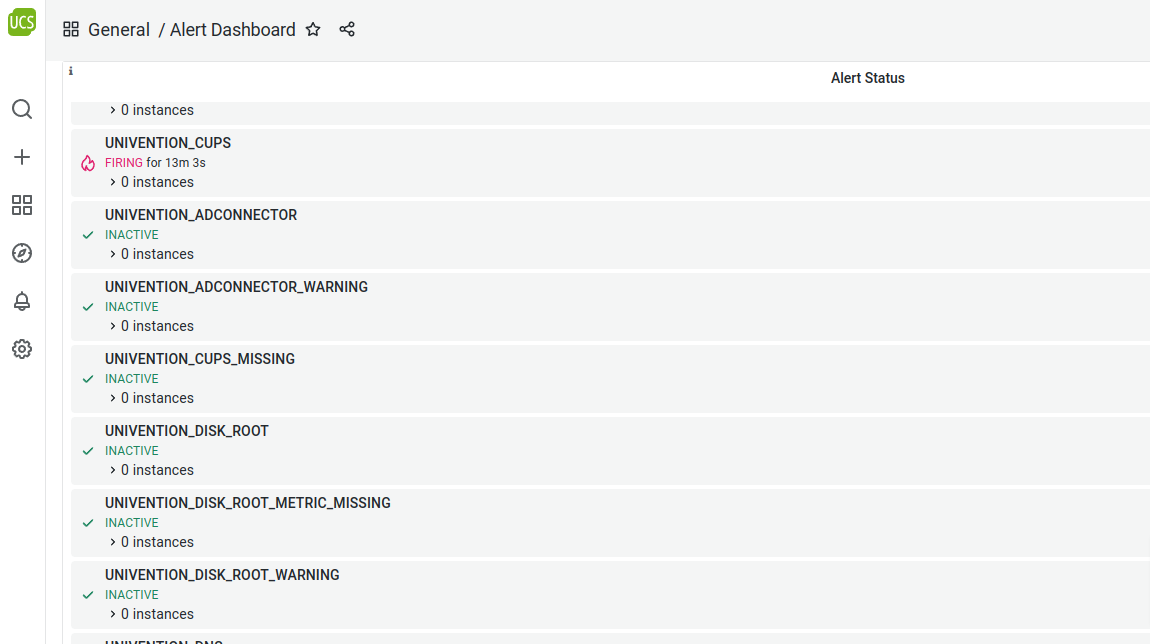
When the operating status changes, the monitoring informs a contact person specified in advance of the possible malfunction. In addition to the reactive notification in case of error, administrators can check the current status at any time continually in the Grafana UCS Dashboard web interface displaying the status information in a compact manner.

Fig. 15.4 Alert dashboard#
See UCS-Dashboard Installation for an overview of all involved components.
Administrators define the alert configuration in Univention Management Console. A listener module automatically generates the configuration files from information stored in the LDAP directory.
15.2.1. Installation#
For installation of the UCS Dashboard components, see Installation.
Additionally to the components of the UCS Dashboard you need to install the Prometheus Alertmanager app and the univention-monitoring-client.
For every UCS system that the administrator wants to show system data on the dashboard, they must install the UCS Dashboard Client app. The package univention-monitoring-client depends on the UCS Dashboard Client app and is installed on every UCS system by default for the alert functionality.
- Prometheus Alertmanager
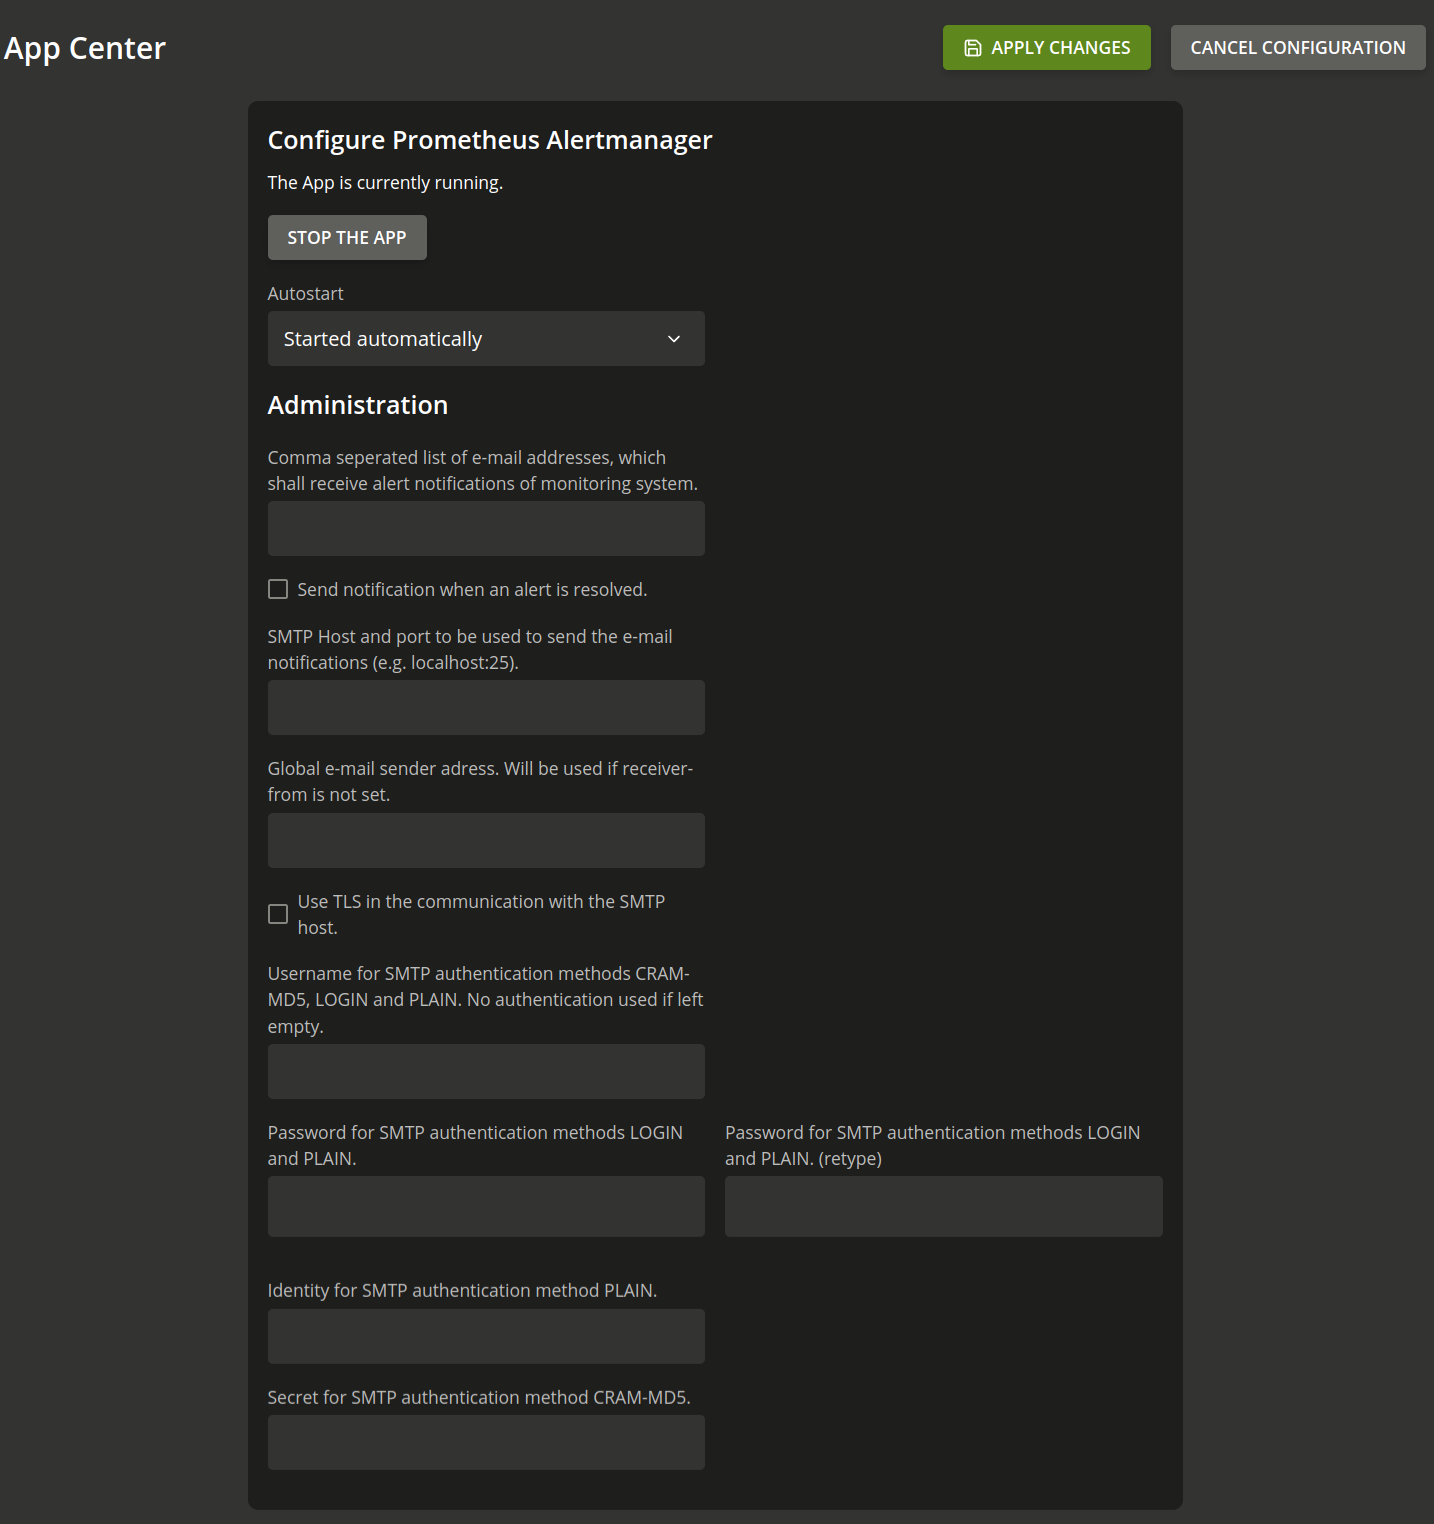
The Prometheus Alertmanager app to send notifications for example through email for firing alerts. The Alertmanager needs some configuration to work properly.

The settings include the recipients of the email alert notifications.
Furthermore, the app settings need a value for a SMTP server to send email
notifications. The Alertmanager supports the SMTP authentication methods
PLAIN, LOGIN, and CRAM-MD5 as well as communication with TLS. No
authentication will be used, if you leave all authentication related fields of
the app settings empty.
- univention-monitoring-client
The package univention-monitoring-client provides standard alert plugins for checking the system health.
Administrators can install plugins with the following packages, that add alerts beyond the standard plugins provided with the univention-monitoring-client package:
univention-monitoring-raid: Monitoring of the software RAID status
univention-monitoring-smart: Test of the S.M.A.R.T. status of hard drives
univention-monitoring-opsi: Test of software distribution OPSI
univention-monitoring-cups: Test of CUPS printing system
univention-monitoring-squid: Test of Squid proxy server
univention-monitoring-samba: Test of the Samba 4 services
univention-monitoring-s4-connector: Test of the S4 Connector
univention-monitoring-ad-connector: Test of the AD Connector
Some services already automatically setup their respective package during installation. For example, if administrators setup the UCS AD Connector, it automatically includes the monitoring plugin.
15.2.2. Preconfigured monitoring checks#
The installation automatically sets up basic monitoring tests for UCS systems.
All alerts have label severity with value critical or warning.
Alert |
Description |
|---|---|
|
Monitors how full the |
|
Tests the function of the local DNS server and the accessibility of the
public DNS server by querying the hostname |
|
Monitors the LDAP server running on UCS Directory Nodes. |
|
Monitors the system load. |
|
Requests the time from the NTP service on the monitored UCS system. If
this deviates by more than |
|
Tests if the SMTP server is reachable. The alert fires if it is not reachable. |
|
Tests the remaining validity period of the UCS SSL certificates. This plugin is only suitable for Primary Directory Node and Backup Directory Node systems. |
|
Monitors the utilization of the swap partition. An error status is raised if the remaining free space falls below the threshold (40% or 20% by default). |
|
Monitors the status of the LDAP replication and recognizes the creation
of a |
|
Tests the availability of the name server cache daemon (NSCD). If there is no NSCD process running, a critical alert is fired; if more than one process is running, a warning alert is fired. |
|
Tests the availability of the Winbind service. If no process is running, a critical alert is fired. |
|
Tests the availability of the Samba service. If no process is running, an alert is fired. |
|
Tests the availability of the NMBD service, which is responsible for the NetBIOS service in Samba. If no process is running, an alert is fired. |
|
Tests the join status of a system. If a system has yet to join, a critical alert is fired; if non-run join scripts are available, a warning alert is fired. |
|
Tests the availability of the Kerberos password service (only available on Primary/Backup Directory Nodes). If fewer or more than one process is running, an alert is fired. |
|
Monitors the status of installed debian packages. If any package has status half-installed an alert is fired. |
|
Monitors the share of free memory pages of the mdb backend of SLAPD for multiple directories. |
|
Monitors the share of free memory pages of the mdb backend of SLAPD for multiple directories regarding the Univention listener. |
The following monitoring alerts are only available once additional packages have been installed (see Monitoring installation).
Alert |
Description |
|---|---|
|
Monitors the OPSI daemon. If no OPSI process is running or the OPSI proxy is not accessible, the alert is fired. |
|
Tests the S.M.A.R.T. status of the hard drive |
|
Tests the status of the software RAID through |
|
Checks the status of the AD connector:
The plugin can also be used in multi-connector instances. |
|
Monitors the CUPS daemon. If there is no cupsd process running or the web interface is not accessible, a critical alert is fired. |
|
Monitors the Squid proxy. If no squid process is running or the Squid proxy is not accessible, the alert is fired. |
|
Monitors the status of present raid devices. The warning alert is fired in case of the following RAID statuses:
The critical alert is fired in case of the following RAID statuses:
|
|
Monitors the status of Samba 4 server. A warning alert is fired if the Samba 4 is reachable and if any rejects are present. A critical alert is fired, if the server is not reachable. |
|
Monitors the status of the samba replication. the alert is fired if any replication failures are present. |
15.2.3. Configuration#
Univention Management Console offers the following settings:
Administrators must configure the alert (see Monitoring installation) and define on which computers of the domain an alert shall be active (see Assign monitoring alerts to computers).
To configure the contact person that the Alertmanager notifies in case of errors or alerts, set the appropriate app setting in the Prometheus Alertmanager app (see Monitoring installation).
Administrators can silence firing alerts for a defined time. See the Prometheus Alertmanager documentation. Use the Prometheus Alertmanager web interface for those settings.
The basic settings already define a large number of tests for each computer, for example an alert basic configuration without the need for any further adjustments.
15.2.3.1. Configure monitoring alerts#
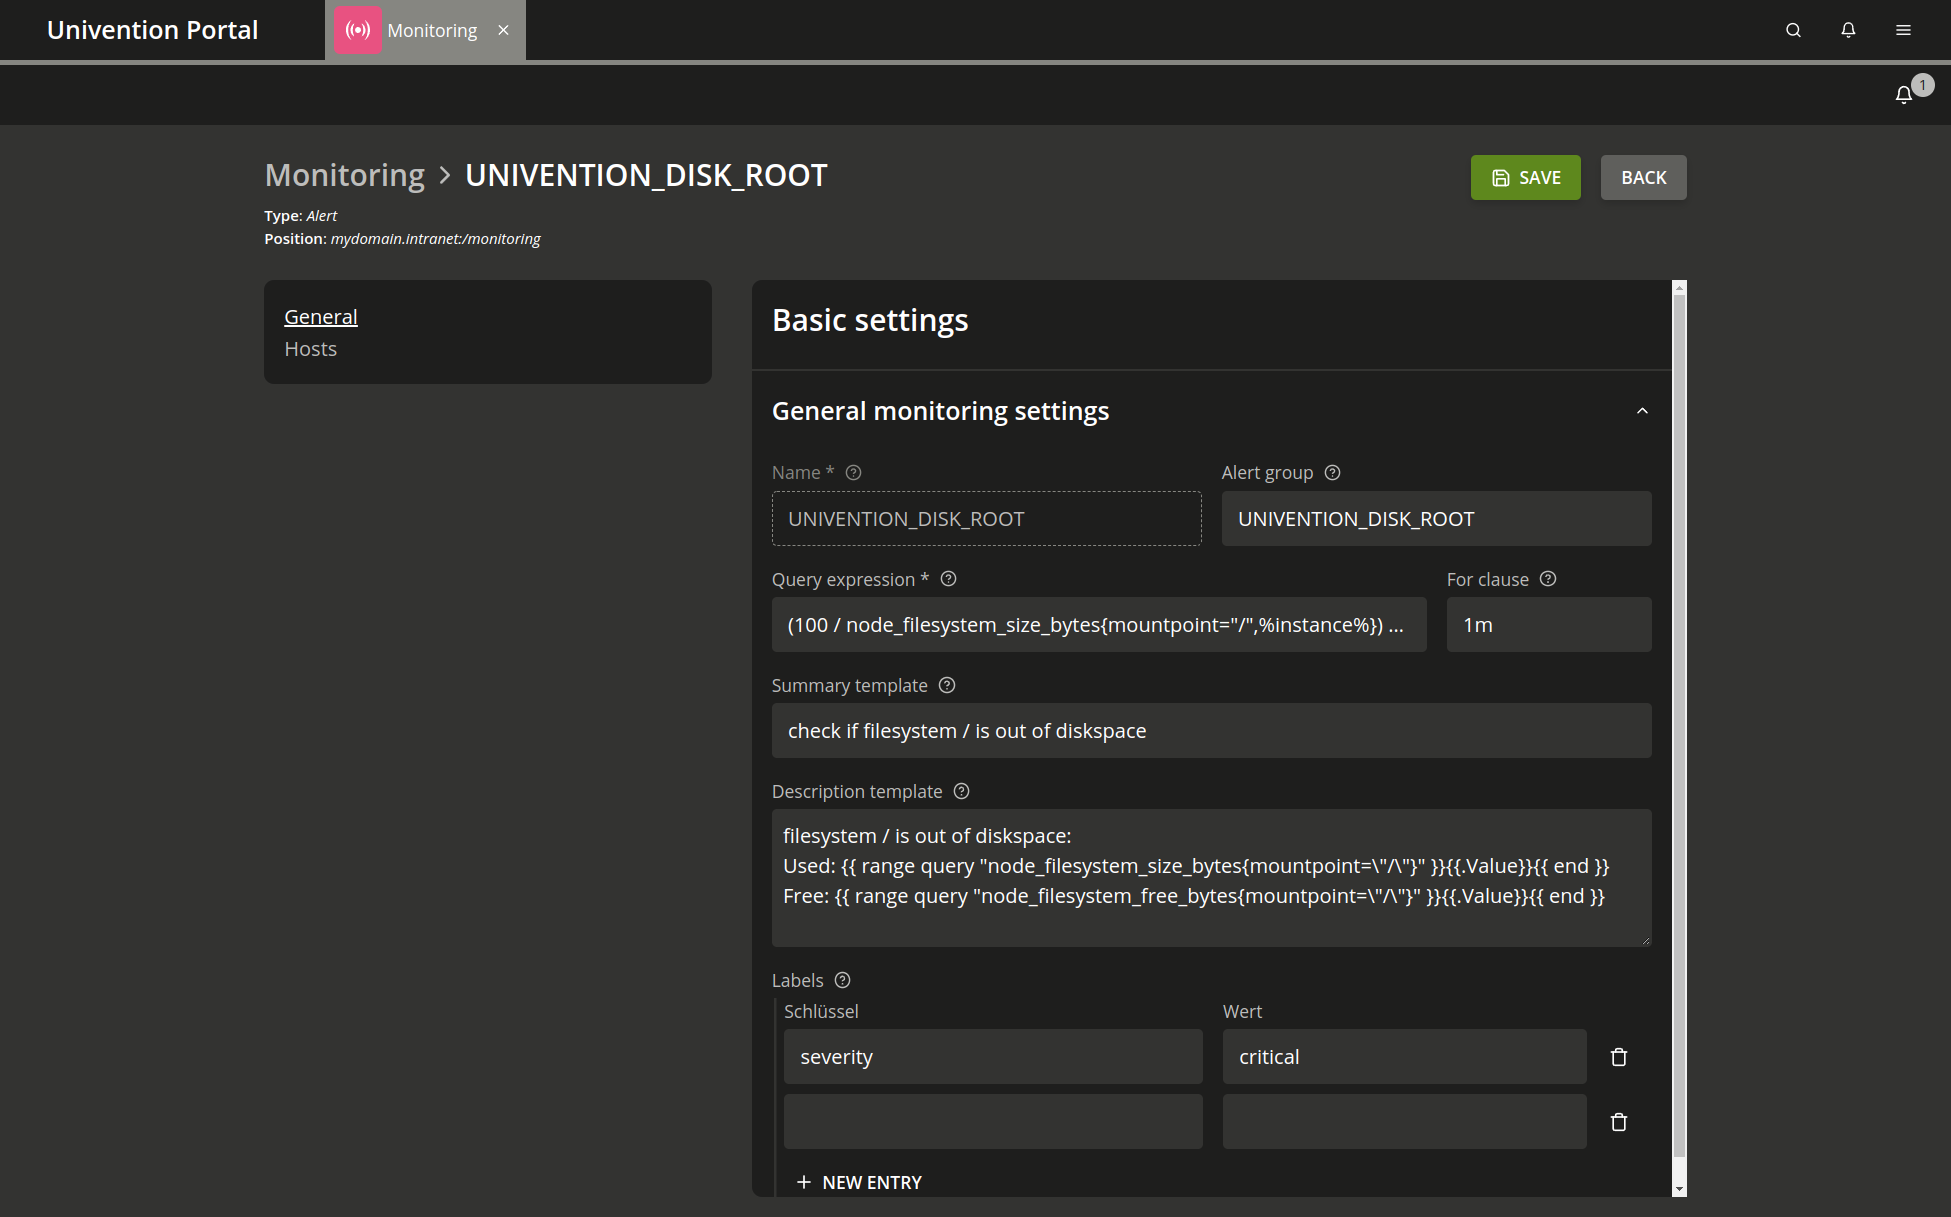
An alert defines the monitoring of a service or a status, for example free disk space. Administrators can assign any number of computers to such an alert object.
Administrators manage monitoring alerts in the UMC module Monitoring with the object type Alert, see Computer management module - Alerts tab. Prometheus has no LDAP interface for the monitoring configuration. Instead, a listener module generates the configuration files when administrators add, edit, or remove alerts.

Fig. 15.5 Configuring an alert#
Attribute |
Description |
|---|---|
|
An unambiguous name for the alert. |
|
Defines the group that includes the alert. Multiple alarms can belong to the same group. |
|
Prometheus query expression, which triggers the alert. The alert triggers when the given query returns a non-empty vector. For details about the syntax, see the Prometheus documentation. |
|
Defines the time that the query expression result is non-empty until the alert triggers. |
|
The title of the alert, shown in alert dashboard and alert email notifications. |
|
The description of the alert, shown in alert dashboard and alert email notifications. |
|
Prometheus attaches labels to alerts. Labels help in queries for
alerts. For example: severity with the value |
|
Query expressions, descriptions and summaries can use variable values.
For example: Reference |
Attribute |
Description |
|---|---|
|
Prometheus executes the query on the computers referenced here. The
listener module runs the tests for the alert. It replaces the term
|
15.2.3.2. Assign monitoring alerts to computers#
Prometheus can monitor all computers administered with Univention Management Console.
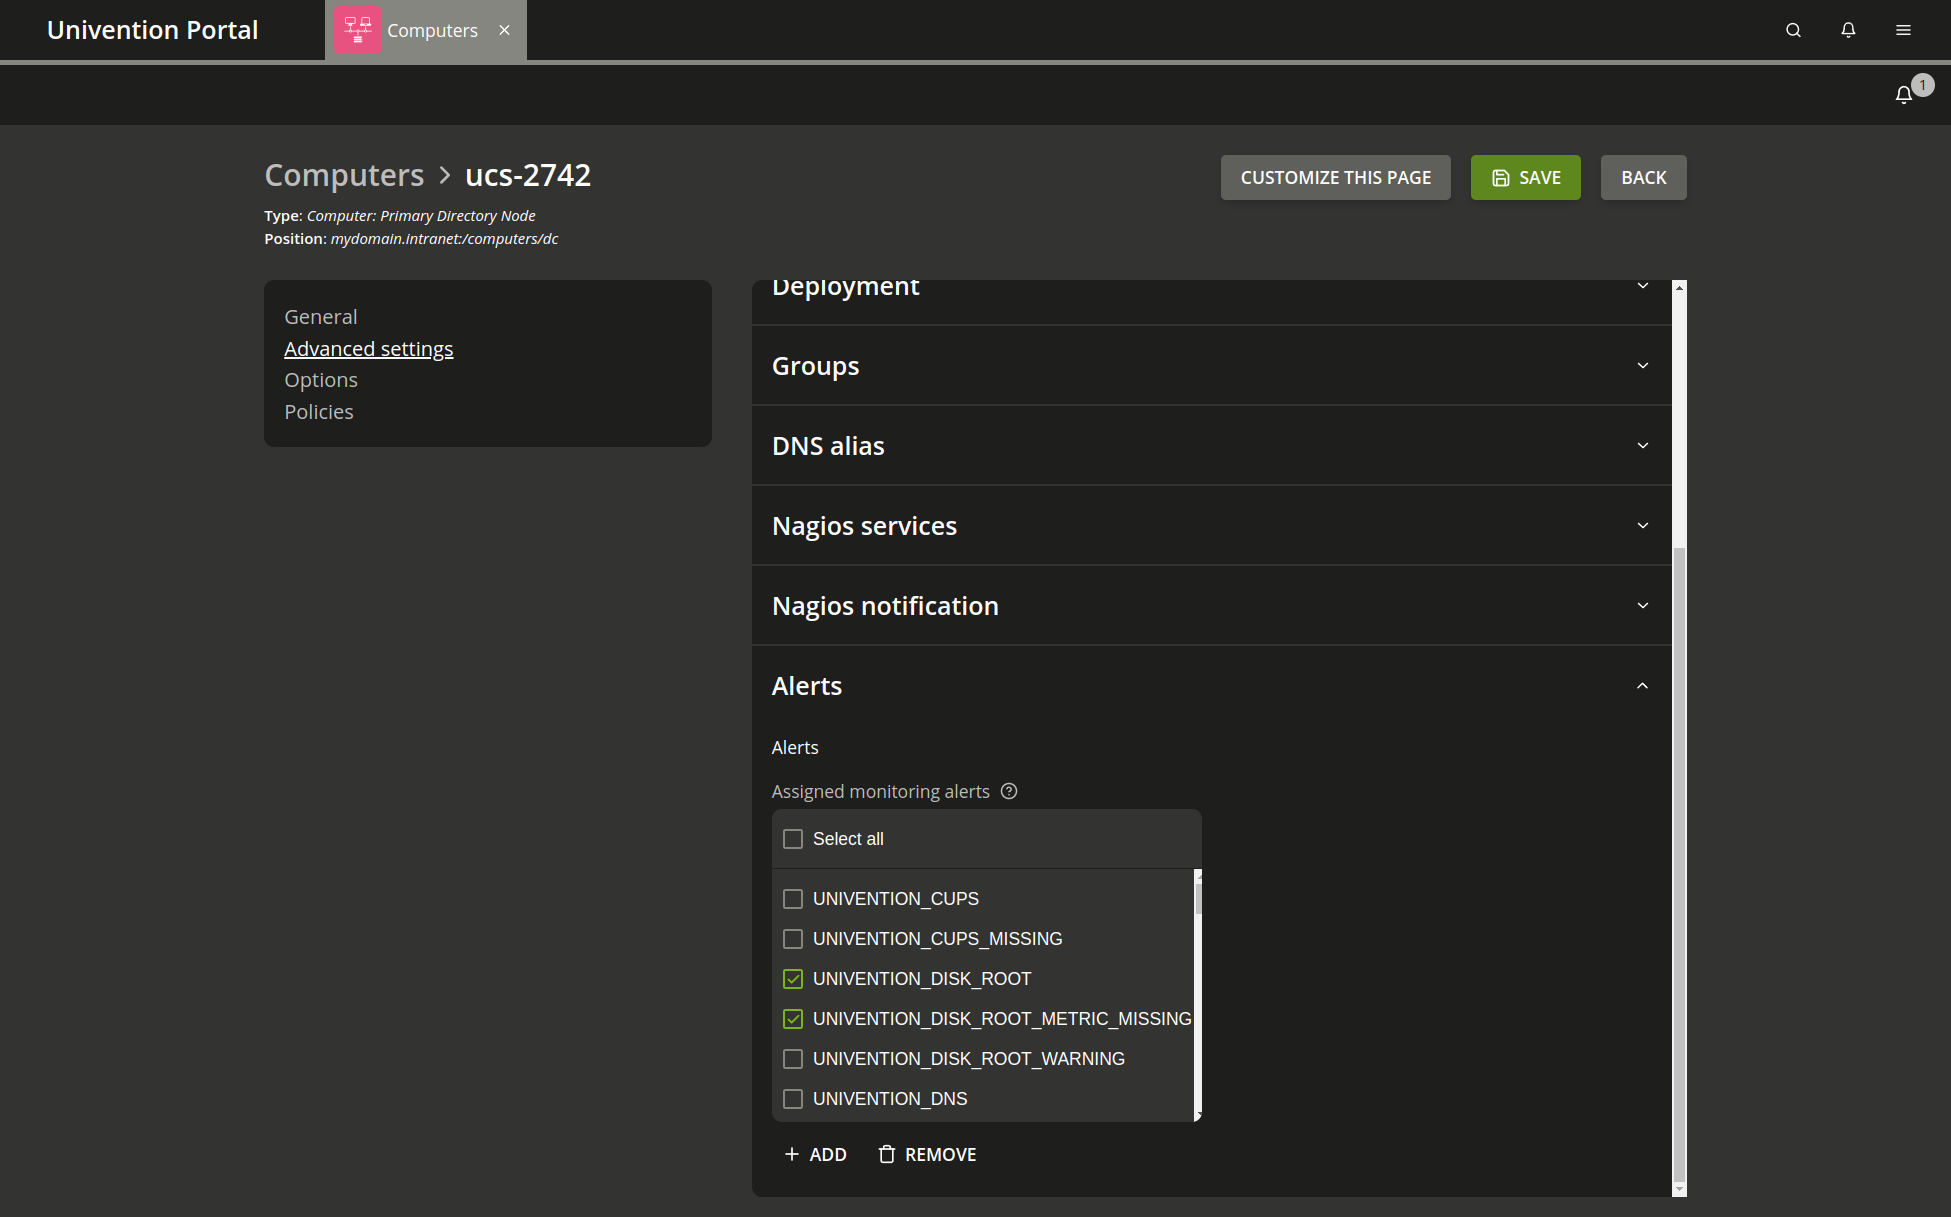
Navigate in the Univention Management Console to Computers and choose the computer you want to activate alerts on. Choose and add all alerts you like in the tab Advanced settings under Alerts and save your changes.

Fig. 15.6 Assigning alert to a host#
Attribute |
Description |
|---|---|
|
Lists all assigned monitoring alerts for the current computer. Add or remove alerts. |
15.2.3.3. Create new alerts#
This section describes how to add a custom script to collect new metrics and create new alerts.
As administrator, you can complement the preconfigured alerts supplied with UCS with additional alerts. An alert check script exports metrics about the machine it runs on to Prometheus. A PromQL query on metrics defines an alert in Prometheus. For more information about how to write custom checks, see Querying basis.
Copy the custom alert check script into the directory
/usr/share/univention-monitoring-client/scripts/ on the UCS system that
shall export the custom metrics. Change the file mode to executable with
chmod a+x PLUGIN.
All alert checks delivered by UCS use Python. Custom checks can use Perl, Python, or Shell and don’t require any external libraries or programs. All UCS systems always provide the needed interpreters.
In contrast, if the custom alert check uses external programs or libraries, ensure you install them on all UCS systems that use the custom alert check.
The alert check script exports one or multiple metrics by writing them to a text
file. It must write valid Prometheus metrics into a .prom file in the
/var/lib/prometheus/node-exporter/ directory. Prometheus imports this
file.
You need to configure the custom alert in Univention Management Console, see Configure monitoring alerts. You must enter a Prometheus expression for the metric of the script to the Query expression field. To assign the custom alert to UCS systems, see Assign monitoring alerts to computers.
See also
- Prometheus naming conventions
- Text-based format of a
.promfile