8.1. UCS Dashboard#
The UCS Dashboard app gives administrators a clear, up-to-date view of the domain and individual servers. You can access the dashboards in a web browser to view live reports on specific aspects.
8.1.1. Installation#
The UCS Dashboard consists of the following three apps:
- UCS Dashboard
Visualizes data from the central database using Grafana [1].
- UCS Dashboard Database
Stores metrics in a time series database using Prometheus.
- UCS Dashboard Client
Collects metrics from server systems using the Prometheus Node Exporter.
You can install the UCS Dashboard app from the Univention App Center on any server in the domain with one of the following roles:
The App Center automatically installs the UCS Dashboard Database and UCS Dashboard Client apps on the same server.
See also
- Univention App Center
for information about Univention App Center.
8.1.2. Accessing the UCS Dashboard#
After installing the UCS Dashboard app,
the portal includes a link to the UCS Dashboard.
Alternatively, you can access the UCS Dashboard directly through
https://SERVERNAME-OR-IP/ucs-dashboard/.
By default, only users in the Domain Admins group can access the dashboard.
For example, the Administrator user has access by default.
To enable other users to access the UCS Dashboard,
add those users to the Domain Admins group.
8.1.3. Dashboards#
The UCS Dashboard app provides three dashboards by default, each showing a different aspect of your domain.
8.1.3.1. Domain dashboard#
After you sign in, the Domain Dashboard opens by default, as shown in Fig. 8.1. This dashboard displays general information about the domain, such as the number of servers and users in the environment. The dashboard also lists all servers in a table, including the server role, installed apps, and whether an update is available. It shows CPU usage, memory usage, free disk space, and the LDAP replication status across all servers.
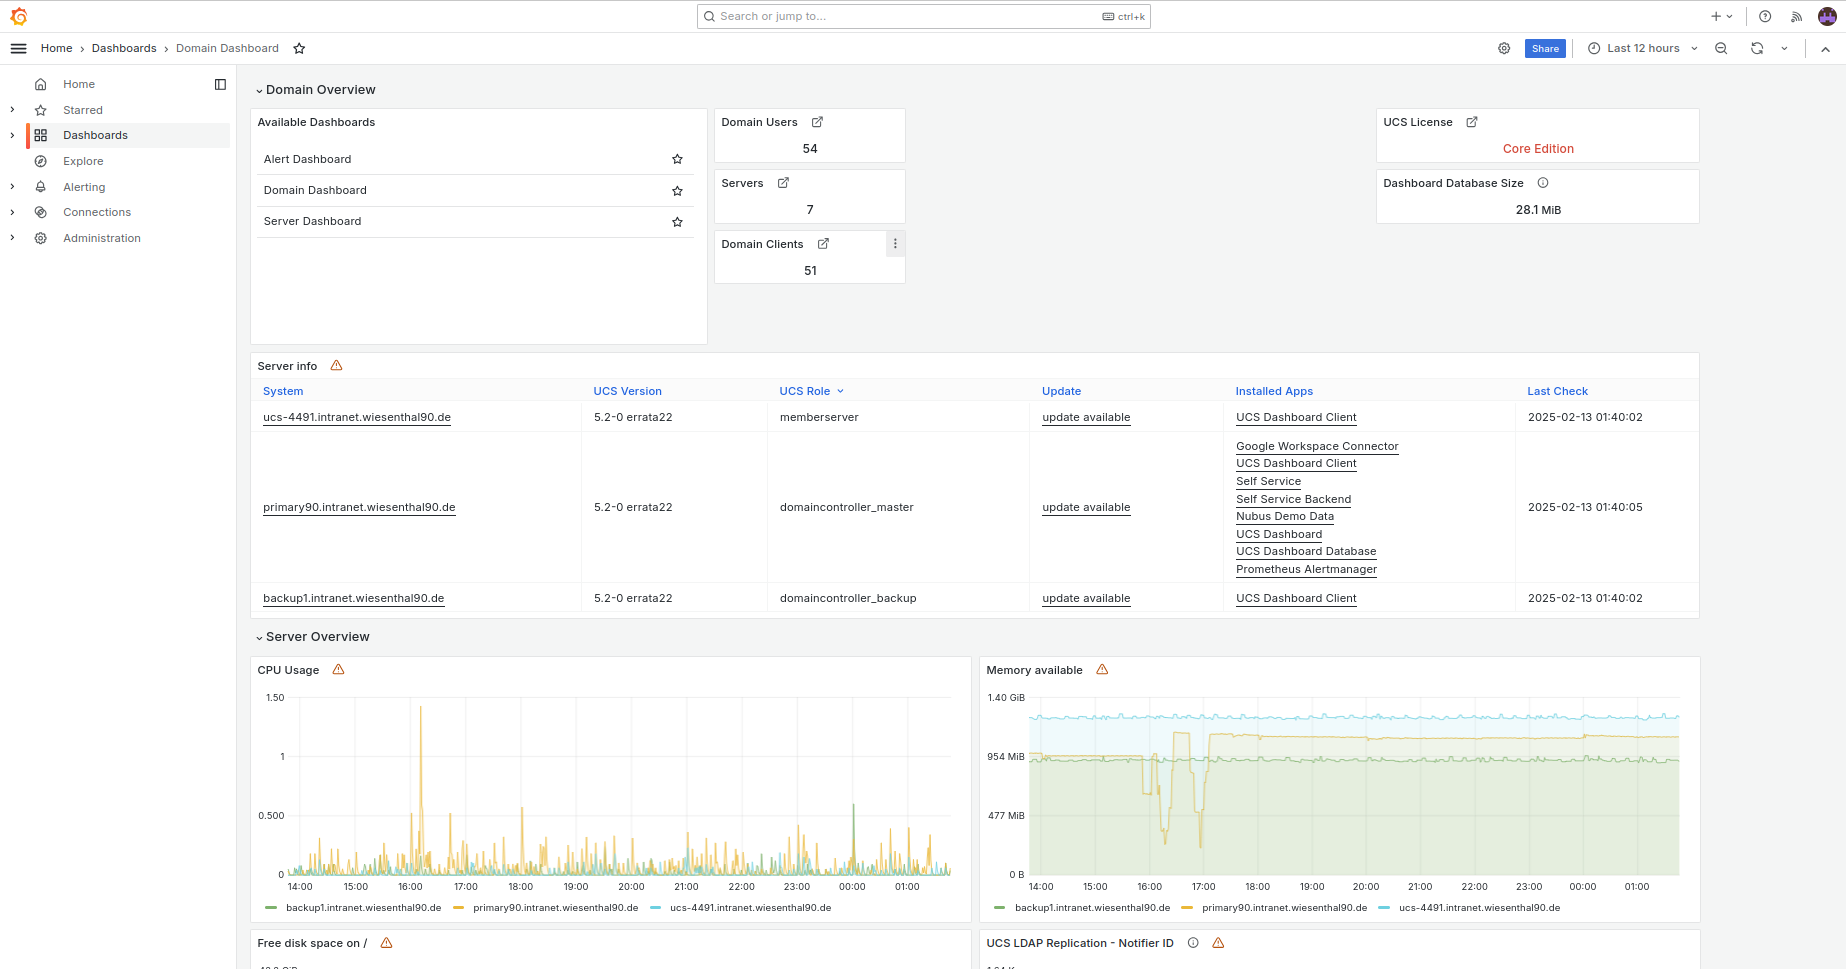
Fig. 8.1 Domain dashboard#
8.1.3.2. Server dashboard#
The Server Dashboard is also available by default, as shown in Fig. 8.2. This dashboard displays detailed information about individual servers, such as CPU usage, memory usage, and network throughput.
Select a server from the Server drop-down. The dashboard updates to show the metrics for the selected server.
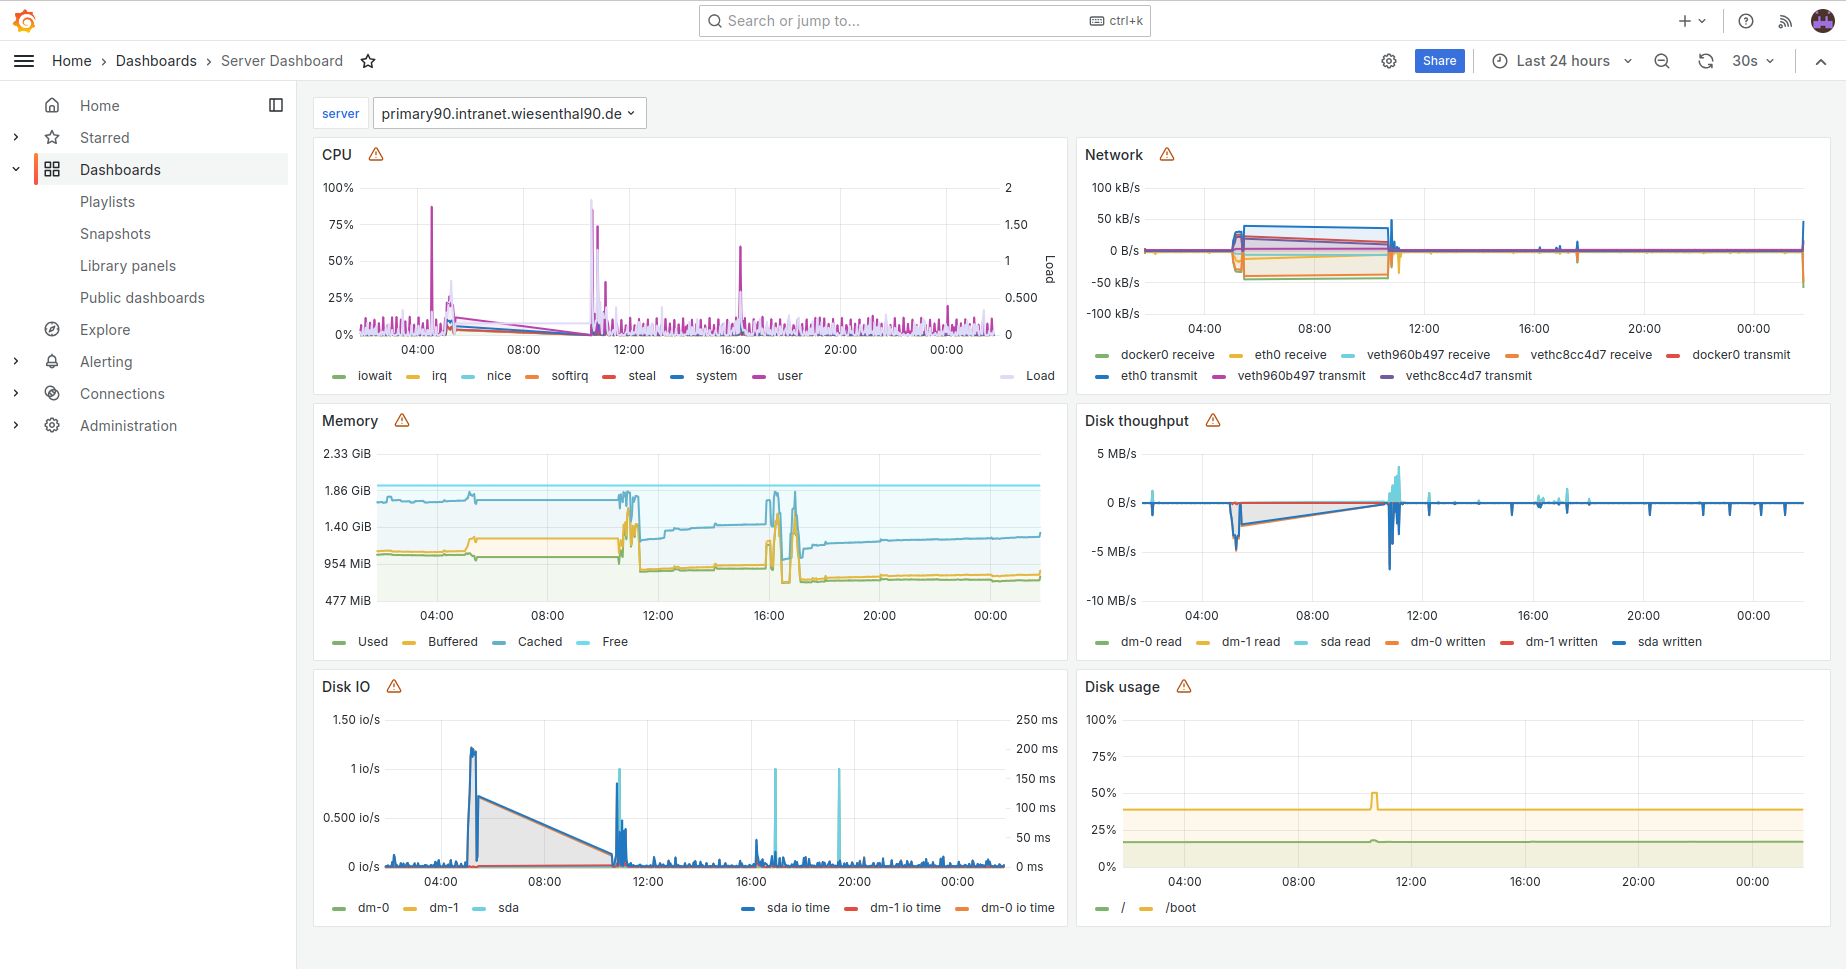
Fig. 8.2 Server dashboard#
8.1.3.3. Alert dashboard#
The UCS Dashboard app includes the Alert Dashboard by default, as shown in Fig. 8.3. It displays the status of all alerts configured in UCS.
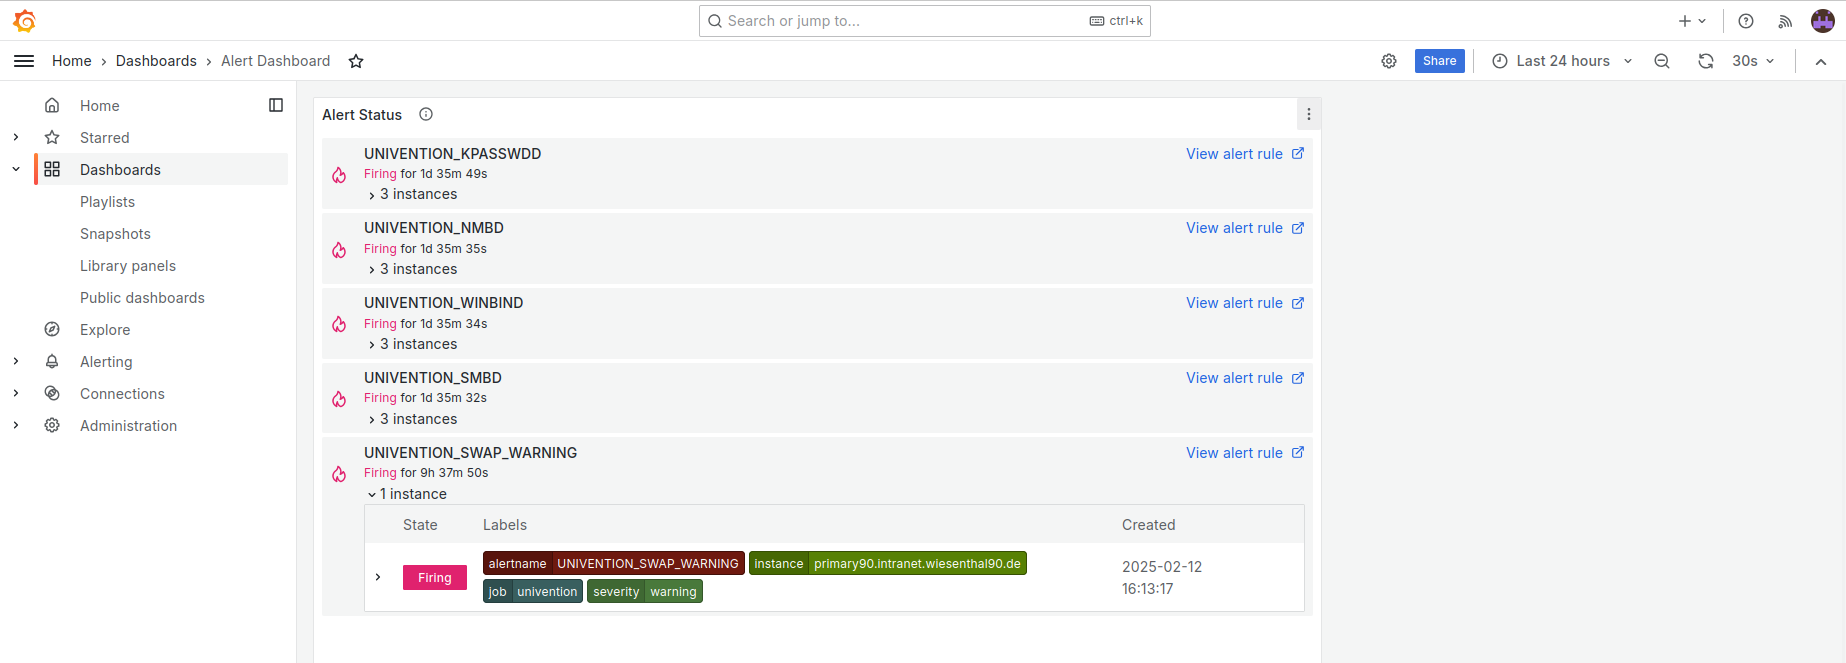
Fig. 8.3 Alert dashboard#
8.1.3.4. Custom dashboards#
You can’t change the three built-in dashboards Domain Dashboard, Server Dashboard, and Alert Dashboard, because Univention provides updates for them.
Instead, you can create your own custom dashboards in Grafana. Click + in the Grafana navigation menu to create a dashboard and add elements to it.