8.2. Monitoring#
Monitoring in Nubus for UCS collects metrics from managed systems and compares them with predefined alert conditions. This helps administrators detect system operation issues early and respond promptly.
Use this page to set up and manage monitoring for Nubus for UCS. It explains the required components, how to configure and assign alerts, which preconfigured checks are available, and how to create custom alerts.
For information about installing and using the UCS Dashboard, see UCS Dashboard.
8.2.1. Installation#
To install the UCS Dashboard components, see Installation. In addition to the UCS Dashboard components, install the Prometheus Alertmanager app on the system that sends alert notifications. For information about how to install apps through the App Center, see How to install applications.
On each monitored Nubus for UCS system, install the UCS Dashboard Client app. Nubus for UCS installs the univention-monitoring-client package by default for alert functionality. Verify that the univention-monitoring-client package is present before you continue.
- Prometheus Alertmanager
The Prometheus Alertmanager app sends notifications for firing alerts, for example by email. Configure the app settings as shown in Fig. 8.4.
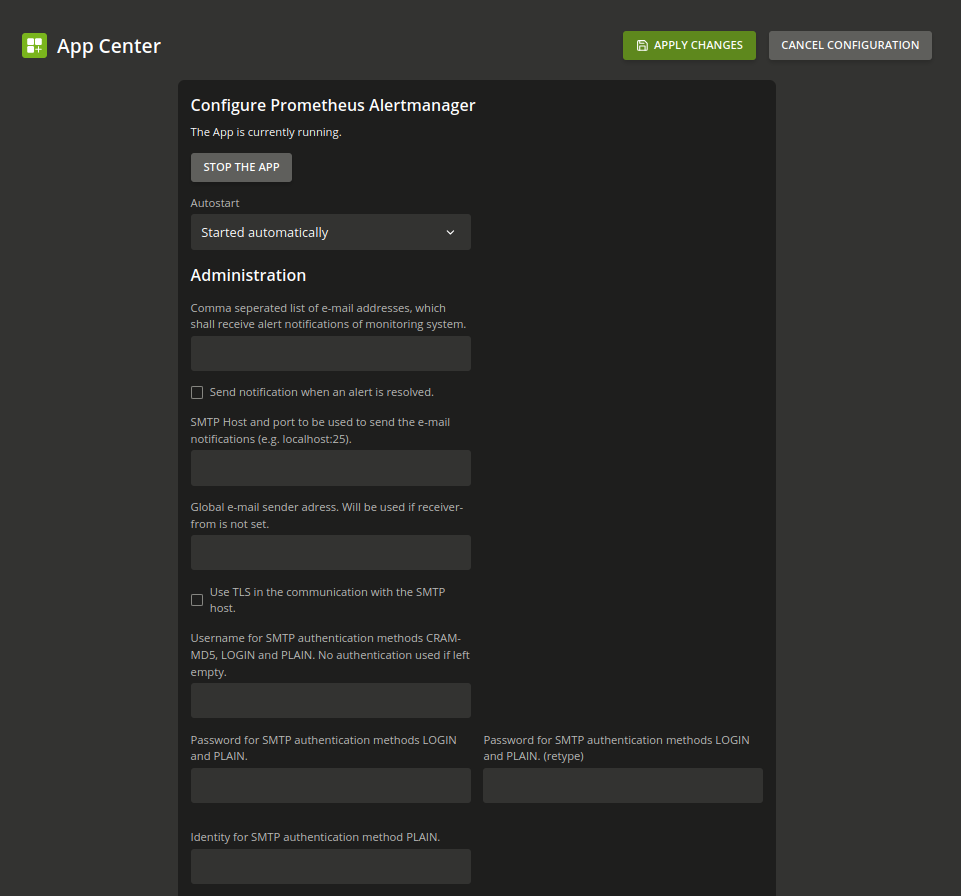
Fig. 8.4 Alertmanager app settings for SMTP and email recipients#
Before you configure Alertmanager, make sure that a reachable SMTP server is available and that you have recipient email addresses. Alertmanager supports the SMTP authentication methods
PLAIN,LOGIN, andCRAM-MD5. It also supports TLS communication. If you leave all authentication-related fields empty, Alertmanager doesn’t use SMTP authentication. After you save the settings, send a test alert to verify that email notifications work.- univention-monitoring-client
The package univention-monitoring-client provides standard alert plugins that check system health.
You can install the following packages to add alerts beyond the standard checks from the univention-monitoring-client package. Some services install their required package during installation. For example, when you set up the Active Directory Connection, Nubus for UCS also installs the monitoring plugin.
univention-monitoring-raid: Monitoring of the software RAID status.
univention-monitoring-smart: Test of the S.M.A.R.T. status of hard drives.
univention-monitoring-opsi: Test of software distribution OPSI.
univention-monitoring-cups: Test of CUPS printing system.
univention-monitoring-squid: Test of Squid proxy server.
univention-monitoring-samba: Test of the Samba services.
univention-monitoring-s4-connector: Test of the S4 Connector.
univention-monitoring-ad-connector: Test of the Active Directory Connection.
8.2.2. Configuration#
Use the Management UI and Alertmanager to configure and handle alerts.
You use alerts to monitor a service or status. For example, administrators can monitor free disk space. You can assign any number of computers to an alert object. You manage alerts in the Monitoring module of the Management UI. Use the object type Alert, as shown in Fig. 8.5. For more information, see Alerts section.
Note
Prometheus doesn’t provide an LDAP interface for monitoring configuration. A listener module generates the configuration files when administrators add, edit, or remove alerts.

Fig. 8.5 Configuring an alert#
8.2.2.1. General tab - Monitoring management#
This section describes the fields on the General tab in the Monitoring management module of the Management UI.
- Name
An unambiguous name for the alert.
- Alert group
Defines the group that includes the alert. Multiple alerts can belong to the same group.
- Query expression
Defines the Prometheus query expression that triggers the alert. The alert triggers when the query returns a non-empty vector.
For details about the syntax, see the Prometheus documentation.
- For clause
Defines how long the query expression must return a non-empty result before the alert triggers.
- Summary template
Specifies the alert title. It appears on the alert dashboard and in alert email notifications.
- Description template
Specifies the alert description. It appears on the alert dashboard and in alert email notifications.
- Labels
Prometheus attaches labels to alerts. These labels help you query alerts. For example, you can use the label severity with the value
criticalorwarning.- Template Values
Query expressions, descriptions, and summaries can use variables. For example,
%max%references the valuemax.
8.2.2.2. Hosts tab - Monitoring management#
This section describes the fields on the Hosts tab in the Monitoring management module of the Management UI.
- Assigned hosts
Prometheus runs the query on the computers listed here. The listener module runs the tests for the alert. It replaces
%instance%in the query expression with a regular expression that matches the assigned hosts.
8.2.2.3. Assign monitoring alerts to computers#
Prometheus can monitor all computers that you manage in the Management UI.
To assign alerts to a computer, do the following:
In the Management UI, open the Computers module and select the computer.
On the Advanced settings tab, under Alerts, add the monitoring alerts that you want to assign, as shown in Fig. 8.6.
Save your changes.
Verify that the assigned alerts appear in the Assigned monitoring alerts list.
- Assigned monitoring alerts
Lists the monitoring alerts assigned to the current computer. You can add or remove alerts here.
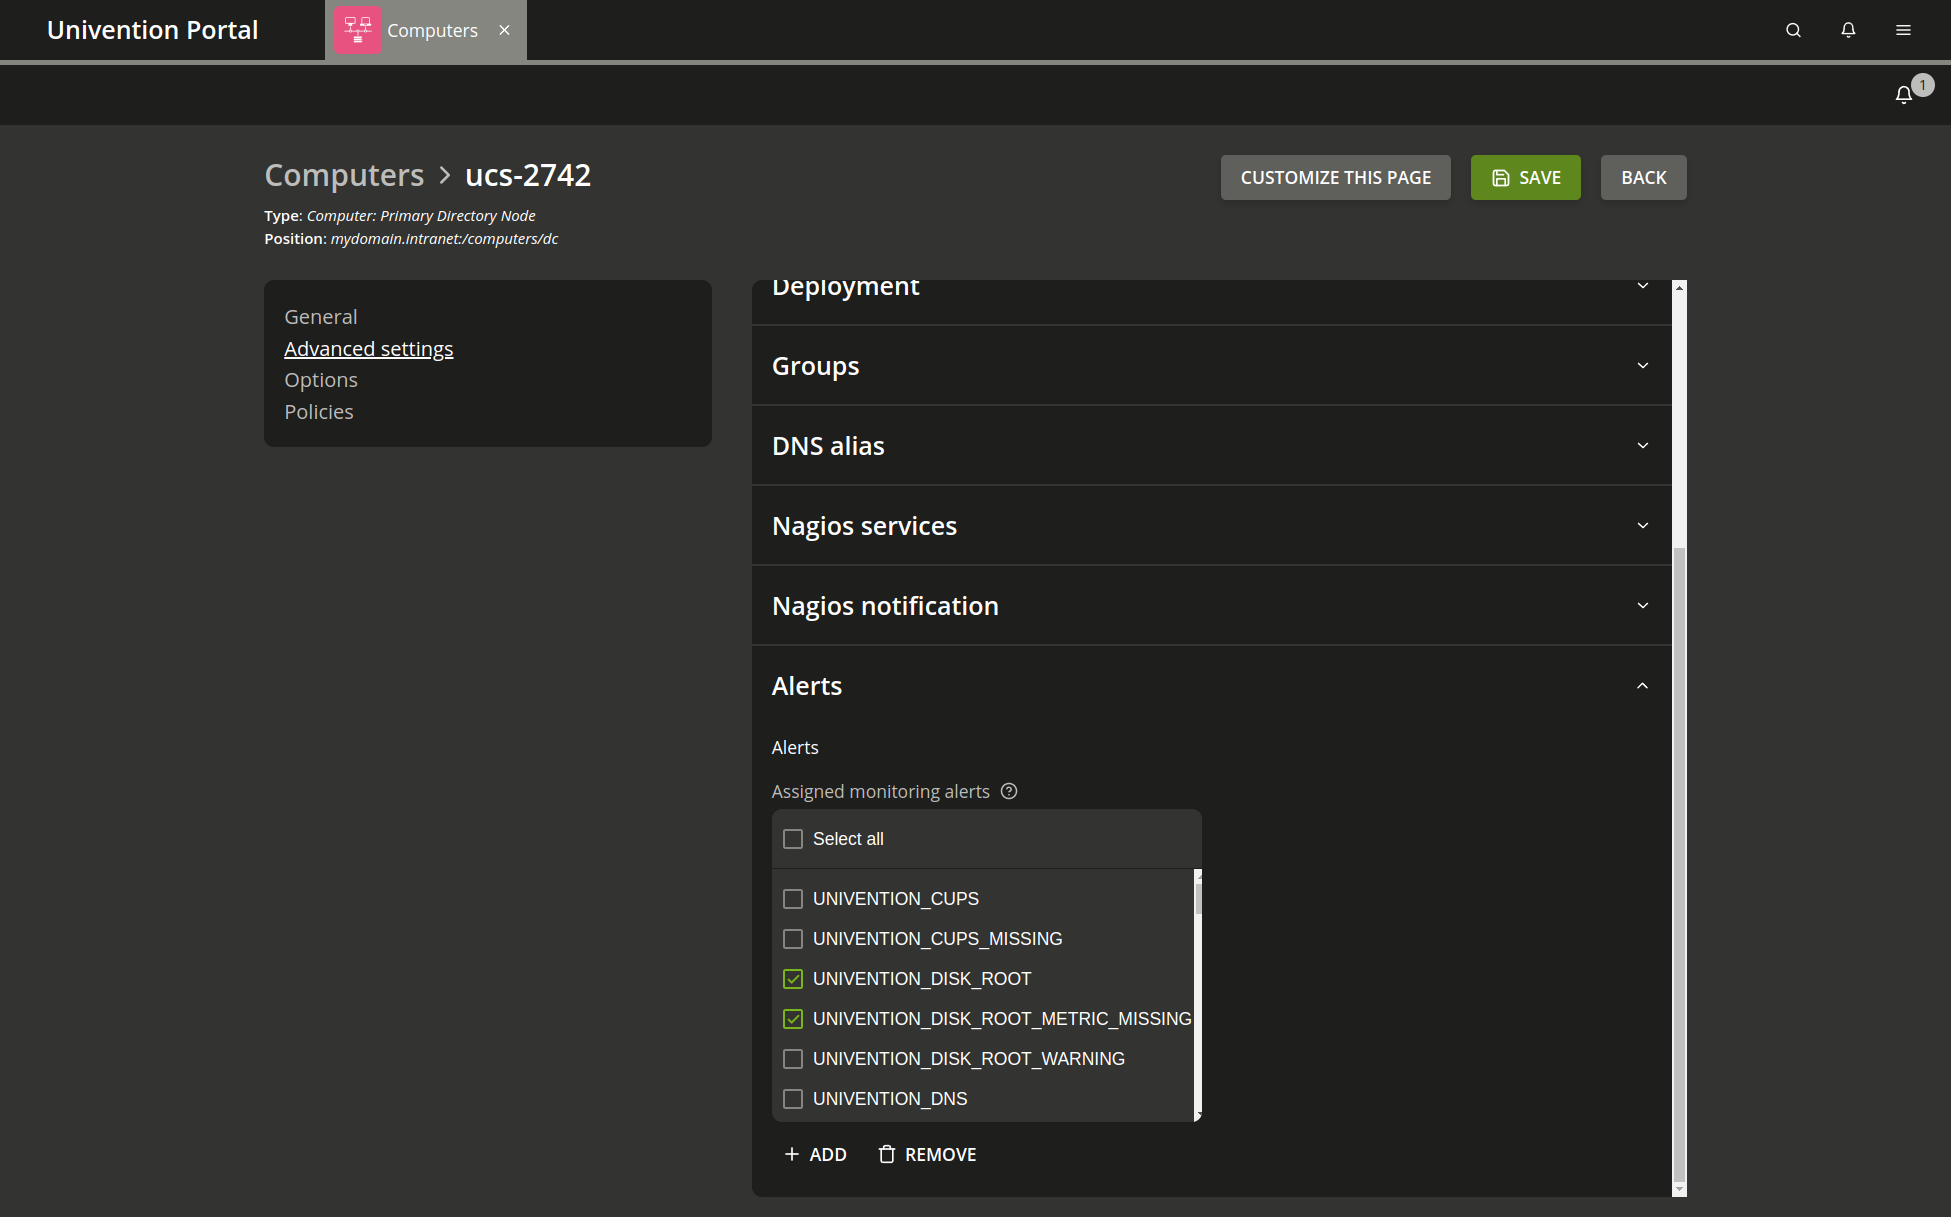
Fig. 8.6 Assigning alerts to a host#
8.2.2.4. Alert silences#
Use the Alertmanager web interface to silence firing alerts for a specific period. For more information about silences, see the Prometheus Alertmanager documentation.
8.2.3. Preconfigured monitoring checks#
Nubus for UCS sets up basic monitoring tests automatically.
All alerts use the severity label
with the value critical or warning.
UNIVENTION_DISK_ROOTandUNIVENTION_DISK_ROOT_WARNINGMonitors how full the
/partition is. The alert fires if the remaining free space falls below 25% or 10% by default.
UNIVENTION_DNSTests the local DNS server and checks whether the public DNS server resolves the hostname
www.univention.de. If the UCS domain has no DNS forwarder, the request fails. In that case, you can use the FQDN of the Primary Directory Node, for example, by setting themonitoring/dns/lookup-domainUCR variable, to test name resolution.
UNIVENTION_LDAP_AUTHMonitors the LDAP server on Nubus for UCS Directory Nodes.
UNIVENTION_LOADandUNIVENTION_LOAD_WARNINGMonitors the system load.
UNIVENTION_NTPandUNIVENTION_NTP_WARNINGRequests the time from the NTP service on the monitored Nubus for UCS system. If the time differs by more than
60or120seconds, the alert fires.
UNIVENTION_SMTPTests whether the SMTP server is reachable. The alert fires if the server isn’t reachable.
UNIVENTION_SSLandUNIVENTION_SSL_WARNINGTests how long the Nubus for UCS TLS certificates remain valid. Use this plugin only on Primary Directory Node and Backup Directory Node systems.
UNIVENTION_SWAPandUNIVENTION_SWAP_WARNINGMonitors the utilization of the swap partition. The alert fires if the remaining free space falls below the threshold of 40% or 20% by default.
UNIVENTION_REPLICATIONandUNIVENTION_REPLICATION_WARNINGMonitors LDAP replication. The alert detects a
failed.ldiffile, stalled replication, and large differences between transaction IDs.
UNIVENTION_NSCDandUNIVENTION_NSCD2Tests the availability of the name server cache daemon (NSCD). If no NSCD process runs, the check triggers a critical alert. If more than one process runs, the check triggers a warning alert.
For information about NSCD, see Name service cache daemon.
UNIVENTION_WINBINDTests the availability of the Winbind service. If no process runs, the check triggers a critical alert.
UNIVENTION_SMBDTests the availability of the Samba service. If no process runs, the check triggers an alert.
UNIVENTION_NMBDTests the availability of the NMBD service, which handles the NetBIOS service in Samba. If no process runs, the check triggers an alert.
UNIVENTION_JOINSTATUSandUNIVENTION_JOINSTATUS_WARNINGTests the join status of a system. If the system hasn’t joined yet, the check triggers a
criticalalert. If join scripts haven’t run, the check triggers awarningalert.
UNIVENTION_KPASSWDDTests the availability of the Kerberos password service. Use this check only on Primary Directory Node and Backup Directory Nodes. If the service doesn’t run exactly one process, the check triggers an alert.
UNIVENTION_PACKAGE_STATUSMonitors the status of installed Debian packages. If any package has the status
half-installed, the check triggers an alert.
UNIVENTION_SLAPD_MDB_MAXSIZEandUNIVENTION_SLAPD_MDB_MAXSIZE_WARNINGMonitors how many free memory pages remain in the mdb backend of SLAPD across multiple directories.
UNIVENTION_LISTENER_MDB_MAXSIZEandUNIVENTION_LISTENER_MDB_MAXSIZE_WARNINGMonitors how many free memory pages remain in the mdb backend of SLAPD across the directories that the Listener uses.
You can use additional monitoring alerts after you install the required packages. For installation details, see Installation.
UNIVENTION_OPSIMonitors the OPSI daemon. If no OPSI process runs or the OPSI proxy isn’t accessible, the alert fires.
UNIVENTION_SMART_SDATests the S.M.A.R.T. status of the hard drive
/dev/sda. Corresponding alerts are available for the hard drives/dev/sdb,/dev/sdc, and/dev/sdd.
UNIVENTION_ADCONNECTORandUNIVENTION_ADCONNECTOR_WARNINGMonitors the status of the Active Directory Connection:
If no connector process runs, the alert fires.
If more than one process runs per connector instance, the check triggers a
warningalert.If rejects occur, the check triggers a
warningalert.If the AD server isn’t reachable, the alert fires.
You can use this plugin in multi-connector instances.
UNIVENTION_CUPSMonitors the CUPS daemon. If no cupsd process runs or the web interface isn’t accessible, the check triggers a
criticalalert.
UNIVENTION_SQUIDMonitors the Squid proxy. If no Squid process runs or the Squid proxy isn’t accessible, the alert fires.
UNIVENTION_RAIDandUNIVENTION_RAID_WARNINGMonitors RAID device status. The check triggers a
warningalert for the following RAID statuses:RebuildingReconstructReplaced DriveExpandingWarningVerify
The check triggers a critical alert for the following RAID statuses:
DegradedDeadFailedErrorMissing
UNIVENTION_S4CONNECTORandUNIVENTION_S4CONNECTOR_WARNINGMonitors the Samba server. If the server is reachable and rejects occur, the check triggers a warning alert. If the server isn’t reachable, the check triggers a critical alert.
UNIVENTION_SAMBA_REPLICATIONMonitors Samba replication. The alert fires when replication fails.
8.2.4. Extend monitoring with new alerts#
Use custom alert checks to collect additional metrics and define alerts for them.
Create a custom alert when you want to collect additional metrics and monitor them in Prometheus. Before you begin, make sure that:
You have administrative access to the target Nubus for UCS system.
The target system includes the required monitoring components.
Every target system includes the external programs or libraries that your custom check uses.
Custom alert checks export metrics from the local system to Prometheus. A PromQL query uses these metrics to define the alert. For more information about writing custom checks, see the Prometheus documentation.
To create a custom alert, do the following:
Copy the custom alert check script to
/usr/share/univention-monitoring-client/scripts/on the target Nubus for UCS system.Replace
PLUGINwith the filename of your custom alert check script. Then make the script executable with the command in Listing 8.1.$ chmod a+x PLUGIN
Write valid Prometheus metrics to a
.promfile in/var/lib/prometheus/node-exporter/.In the Management UI, configure the custom alert. For details, see Configuration.
Enter the Prometheus expression for the script metric in the Query expression field.
Assign the custom alert to the required systems. For details, see Assign monitoring alerts to computers.
Verify that Prometheus reads the exported metrics. For example, confirm that the metric appears in Prometheus and that the alert is available in the alert configuration.
Note
All alert checks that Nubus for UCS provides use Python. Custom checks can use Perl, Python, or shell scripts. These checks don’t require external libraries or programs unless the script uses them.
See also
- Metric and label naming
for information about Prometheus naming conventions.
- Exposition formats
for information about text-based format of a
.promfile.